empty
06.11.2023 06:29 AM
BITCOIN: Technical analysis of the situation

Bitcoin

This image is no longer relevant

Higher timeframes

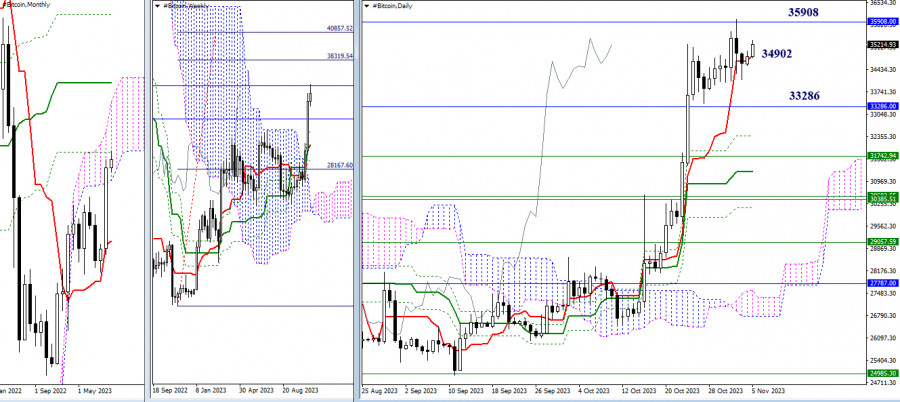
October provided bulls with moments of optimism, pushing the market away from the support of the monthly short-term trend towards the next resistance of the monthly death cross (35,908). Meanwhile, Bitcoin managed to close October within the monthly cloud (33,286), making the upper boundary of the Ichimoku cloud (40,490) the next upward target on this timeframe.

The result of October's activity was also the formation of an upward target for breaking the weekly cloud (38,320 - 40,858). These target levels (38,320 - 40,490 - 40,858) have been planned by the bullish players for November following the optimism and activity of October. This will only be possible if the bulls maintain and continue the October sentiment.

If priorities change and the bears return to the market. In that case, their focus will first be on exiting the monthly cloud (33,286) and then testing and liquidating the existing golden crosses of Ichimoku on the weekly and daily timeframes. The nearest supports from the golden crosses of Ichimoku at the moment can be noted at 32,380 - 31,743 - 31,261.

This image is no longer relevant

H4 - H1

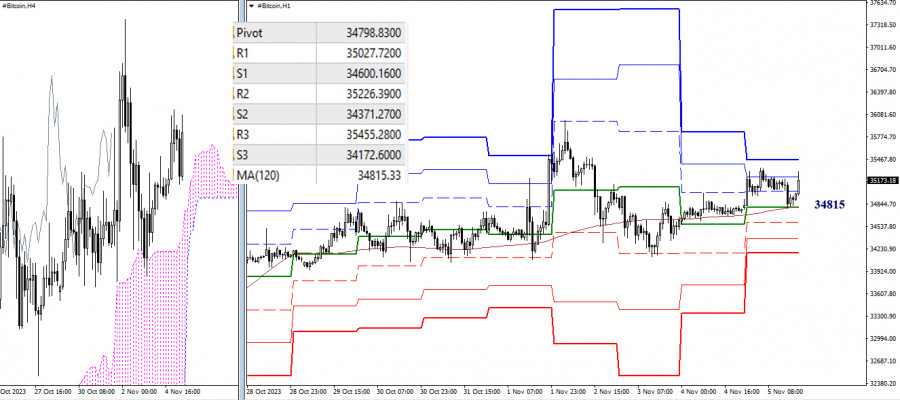
As of writing, the main advantage on the lower timeframes remains with the bullish players. However, the balance of power is very fragile because the weekly long-term trend (34,815) has been acting as support for a long time, responsible for the distribution and balance of power. Bitcoin can lose this support at any moment, after which the market's attention will shift within the day to the supports of the classic pivot points. The primary priority in this case will be the strengthening of bearish sentiments.

Note that the loss of the key level of the lower timeframes—34,815 (weekly long-term trend), is currently associated with losing the center of attraction of the daily timeframe—34,902 (short-term trend). A secure consolidation below 34,902 - 34,815 opens up new prospects for bears, both within the day and on the higher timeframes.

***

The technical analysis of the situation uses:

Higher timeframes - Ichimoku Kinko Hyo (9.26.52) + Fibo Kijun levels

H1 - Pivot Points (classic) + Moving Average 120 (weekly long-term trend)

Evangelos Poulakis,
Analytical expert of InstaForex
© 2007-2025
Summary
Urgency
Analytic
Zhizhko Nadezhda
Start trade
通过InstaForex赚取加密货币汇率变动的收益。
下载MetaTrader 4并开启您的第一笔交易。
  • Grand Choice
    Contest by
    InstaForex
    InstaForex always strives to help you
    fulfill your biggest dreams.
    JOIN CONTEST

推荐文章

2025年8月12日歐元/美元匯率預測

隨著股市下跌(S&P 500 指數下跌 0.25%)的影響,歐元昨天下跌了 25 點,跌破了 1.1632 的支撐水平。如果今天收盤低於此水平,將確認此突破並為向 1.1495 目標邁進打開道路。

Laurie Bailey 04:53 2025-08-12 UTC+2

2025年8月12日英鎊/美元預測

英鎊僅以上影線突破了1.3452的中間水準。當日收盤下跌22點。

Laurie Bailey 04:53 2025-08-12 UTC+2

2025年8月12日美元/日元預測

昨日,美元/日元貨幣對突破了148.03的信號水平(即6月23日的高點)。今天的交易在這一水平之上開盤,同時,Marlin振盪指標的信號線也移到了上升趨勢的邊界之上。

Laurie Bailey 04:53 2025-08-12 UTC+2

XAU/USD 分析與預測

週一,盤中跌勢使金價跌至3365關口以下,但日線圖上的震盪指標尚未開始增強負面動能。這表明貴金屬可能在3350或50日SMA找到支撐。

Irina Yanina 19:34 2025-08-11 UTC+2

2025年8月11日至15日EUR/USD交易信號:在1.1650以下賣出(200 EMA - 7/8 Murray)

在美國盤早段,歐元的交易價大約在1.1590。經歷了試圖突破下降趨勢通道的失敗後,EUR/USD跌破了21 SMA以及7/8 Murray,這使得其展現出看跌的前景。

Dimitrios Zappas 17:54 2025-08-11 UTC+2

2025年8月11日至15日黃金(XAU/USD)交易信號:若低於3,380美元賣出,或如反彈至3,341(21 SMA - 7/8 Murray)則買入。

本週金價開盤價低於 Murray 7/8,即 3,398,從該點開始,我們可以看到技術上的修正正在進行中。金價在 3,384 的多頭通道區域可能會出現技術反彈。

Dimitrios Zappas 17:51 2025-08-11 UTC+2

2025年8月11日歐元/美元匯率預測

週五,EUR/USD在1.1637–1.1645支撐區進行了兩次反彈,對歐元有利。這意味著今天的上行走勢可能會繼續朝向76.4% Fibonacci 回撤位1.1695。

Samir Klishi 10:44 2025-08-11 UTC+2

2025年8月11日英鎊/美元匯率預測

在小時圖上,英鎊/美元在星期五從1.3425水平兩次反彈,並在星期一繼續向上移動,接近76.4%回撤水平1.3470。若從此水平反彈,將有利於美元,並可能回撤至1.3425及支撐區1.3357–1.3371。

Samir Klishi 10:25 2025-08-11 UTC+2

外匯預測2025年11月08日:歐元/美元,美元/日元,英鎊/美元,黃金,以太坊和比特幣

實用連結: 我的其他文章可以在這個部分找到 InstaForex 新手課程 熱門分析 開立交易帳戶 重要提示: 外匯交易初學者在決定進入市場時需要非常謹慎。在重要報告發布前,最好遠離市場,以避免因波動性增加而遭遇劇烈的市場波動。

Sebastian Seliga 10:20 2025-08-11 UTC+2

GBP/USD。本週(8月11日至16日)的技術分析

趨勢分析 本週,從1.3450水準(接近上週的收盤線)開始,價格可能會向下移動至1.3270——一個歷史支撐位(藍色虛線)。在測試此水準後,價格可能會繼續向下移動至1.3141——38.2%回撤水準(紅色虛線)。

Stefan Doll 10:02 2025-08-11 UTC+2
现在无法通话?
提出您的问题,用 在线帮助.
Widget callback
 

Dear visitor,

Your IP address shows that you are currently located in the USA. If you are a resident of the United States, you are prohibited from using the services of InstaFintech Group including online trading, online transfers, deposit/withdrawal of funds, etc.

If you think you are seeing this message by mistake and your location is not the US, kindly proceed to the website. Otherwise, you must leave the website in order to comply with government restrictions.

Why does your IP address show your location as the USA?

  • - you are using a VPN provided by a hosting company based in the United States;
  • - your IP does not have proper WHOIS records;
  • - an error occurred in the WHOIS geolocation database.

Please confirm whether you are a US resident or not by clicking the relevant button below. If you choose the wrong option, being a US resident, you will not be able to open an account with InstaForex anyway.

We are sorry for any inconvenience caused by this message.