empty
28.05.2025 11:32 AM
Forecast for EUR/USD on May 28, 2025

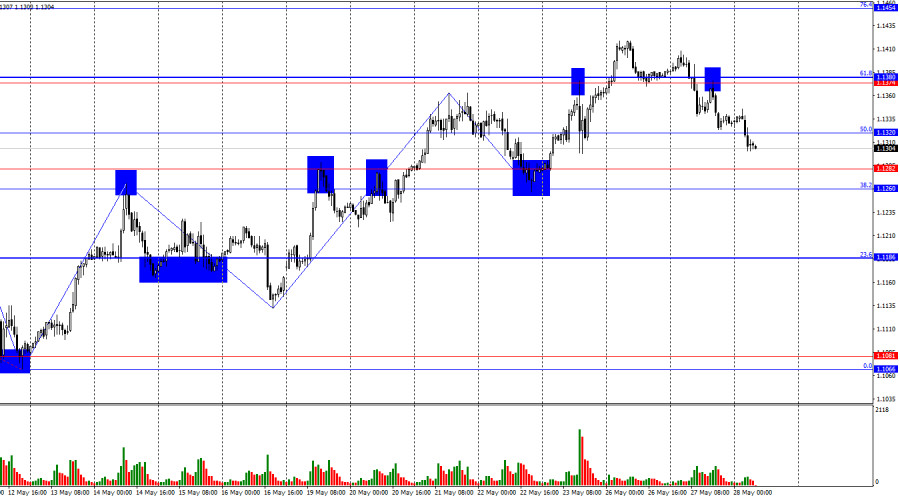
On Tuesday, the EUR/USD pair consolidated below the 1.1374–1.1380 zone and then rebounded from it from below. This confirms the continuation of the downward move, and a close below the 50.0% retracement level at 1.1320 suggests the pair may continue to decline toward the 1.1260–1.1282 zone. A rebound from any level or support zone could spark a renewed bullish advance, preserving the uptrend.

This image is no longer relevant

The wave pattern on the hourly chart has shifted. The most recent upward wave broke above the previous high, and the last completed downward wave failed to break the previous low. This confirms a bullish trend. The current trend can only be considered over if the pair consolidates below the 1.1260–1.1282 support zone. That would mark a new downward wave breaking the previous low.

Recent news of the suspension of tariff hikes for the EU supported the bears, but it may not be enough to break the bullish trend. The fundamental backdrop on Tuesday again favored the bears for the second day in a row. The only report of the day—on U.S. durable goods orders—came out better than expected. However, the data was not genuinely positive, as April orders fell by 6.3% following a 7.6% surge in March. This signals the impact of Donald Trump's tariffs is beginning to show in economic indicators—and not in the best way. U.S. GDP declined by 0.3% in Q1, a rare occurrence in recent years.

As a result, bears may soon run out of steam. We won't speculate on when that might happen. For now, the bullish trend remains intact, with no graphic signs of a reversal. If they emerge, then we can reassess for a potential bearish shift.

This image is no longer relevant

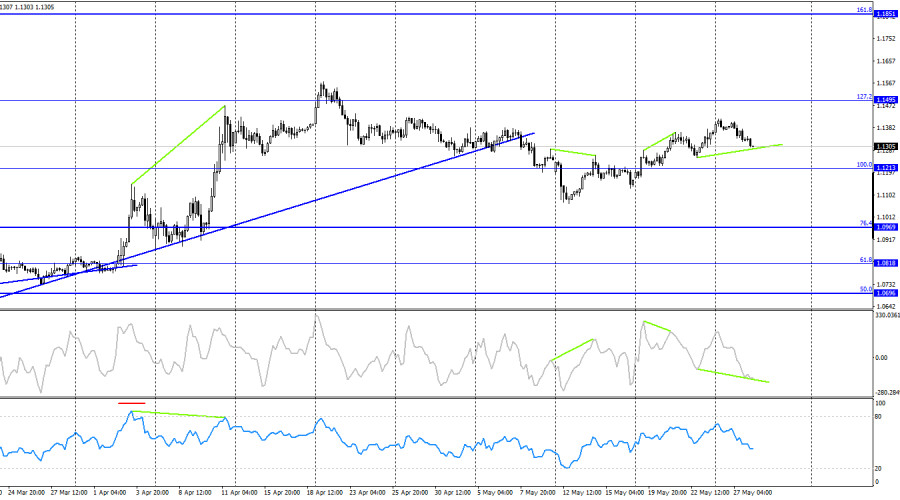
On the H4 chart, the pair has turned in favor of the euro and continues rising toward the 127.2% Fibonacci level at 1.1495. A previous bearish divergence resulted in only a minor pullback. A bullish divergence is forming on the CCI indicator, which could halt the local decline and support a new upward move.

Commitments of Traders (COT) Report

This image is no longer relevant

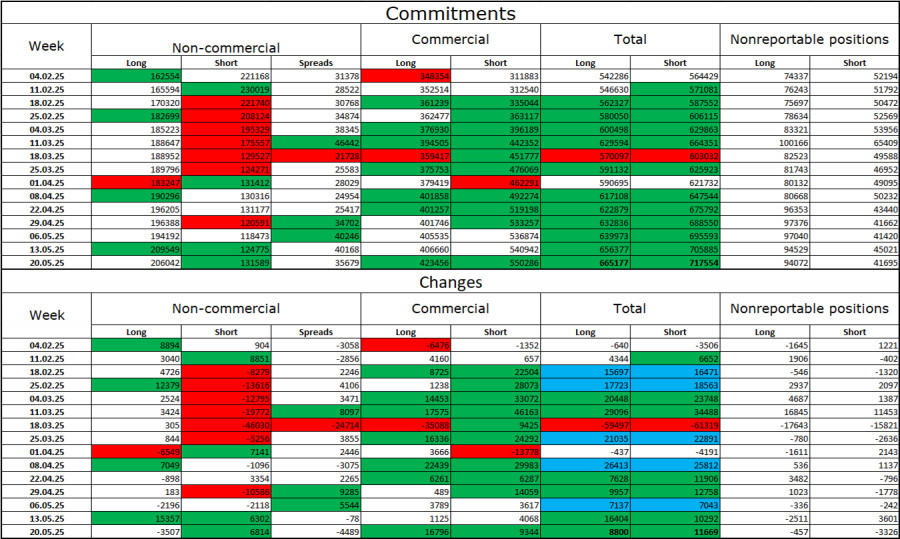
In the most recent COT report, long positions held by speculators declined by 3,507. Short positions rose by 6,814. Net positioning remains bullish, largely due to Donald Trump's policies.

There are currently 206,000 long positions versus 132,000 short positions. The gap continues to widen in favor of the bulls. This means the euro remains in demand, while the dollar does not. The trend has persisted for 16 consecutive weeks, with large players reducing short exposure and increasing longs.

The divergence in monetary policy between the ECB and the Fed continues to favor the dollar on paper, but Trump's trade policies overshadow this advantage, threatening to push the U.S. into recession with long-term consequences.

News Calendar – May 28

  • EU: German Unemployment Rate (07:55 UTC)
  • U.S.: FOMC Meeting Minutes (18:00 UTC)

The economic calendar for Wednesday includes two key entries. However, the fundamental impact is expected to be weak. Bears are unlikely to get the support they need from these events.

EUR/USD Forecast and Trading Tips

Short positions were valid after a close below the 1.1374–1.1380 zone, targeting 1.1320 and 1.1282. The first target has already been reached. Long positions are advisable on a rebound from the 1.1260–1.1282 support zone (hourly chart), with targets at 1.1320 and back toward 1.1374–1.1380. The bears are attacking, but their momentum may be fading.

Fibonacci Levels:

  • Hourly chart: based on 1.1574–1.1066
  • 4-hour chart: based on 1.1214–1.0179
Samir Klishi,
انسٹافاریکس کا تجزیاتی ماہر
© 2007-2025
Summary
Urgency
Analytic
Grigory Sokolov
Start trade
انسٹافاریکس کے ساتھ کرپٹو کرنسی کی معاملاتی تبدیلیوں سے کمائیں۔
میٹا ٹریڈر 4 ڈاؤن لوڈ کریں اور اپنی پہلی ٹریڈ کھولیں۔
  • Grand Choice
    Contest by
    InstaForex
    InstaForex always strives to help you
    fulfill your biggest dreams.
    مقابلہ میں شامل ہوں

تجویز کردہ مضامین

یو ایس ڈی / جے پی وائے۔ تجزیہ اور پیشن گوئی

تکنیکی نقطہ نظر سے، جگہ کی قیمتیں ہفتہ وار تجارتی حد کے اندر رہتی ہیں۔ تاہم، مکمل بیئرش کنسولیڈیشن کی تصدیق کرنا قبل از وقت ہے، کیونکہ روزانہ چارٹ

Irina Yanina 16:04 2025-08-08 UTC+2

اگست 7-9 2025 کے لیے یورو / یو ایس ڈی کے لیے تجارتی سگنل: 1.1680 سے نیچے فروخت کریں (200 ای ایم اے - 7/8 مرے)

یہ کہ 1.1590 سے نیچے فیصلہ کن بریک یورو کے لیے تیز تکنیکی تصحیح کا اشارہ دے سکتا ہے، اس لیے یورو / یو ایس ڈی کے 1.1474 پر 6/8

Dimitrios Zappas 19:54 2025-08-07 UTC+2

اگست 7-9 2025 کے لیے بٹ کوائن کے لیے تجارتی سگنل: $117,110 سے نیچے فروخت (200 ای ایم اے - 21 ایس ایم اے)

دوسری طرف، اگر بٹ کوائن 114,500 پر واقع 200 ای ایم اے سے نیچے آتا ہے اور اس علاقے کے نیچے مضبوط ہوتا ہے، تو اس کے 112,500 تک پہنچنے

Dimitrios Zappas 19:49 2025-08-07 UTC+2

اگست 7-9 2025 کے لیے سونے (ایکس اے یو / یو ایس ڈی) کے لیے تجارتی سگنل: $3,400 یا $3,373 سے کم فروخت کریں (21 ایس ایم اے - 7/8 مرے)

اگر سونا تیزی سے اپ ٹرینڈ چینل کو توڑتا ہے اور 21 ایس ایم اے سے نیچے مستحکم ہوتا ہے، تو اسے فروخت کرنے کے ایک موقع

Dimitrios Zappas 19:47 2025-08-07 UTC+2

AUD/JPY. Analysis and Forecast

اے یو ڈی / جے پی وائے پئیر خریداری کی دلچسپی کو اپنی طرف متوجہ کرنے کے لیے جدوجہد کر رہا ہے، 95.00 کی نفسیاتی سطح کے قریب تجارت

Irina Yanina 14:23 2025-08-05 UTC+2

اگست 4-7 2025 کے لیے یورو / یو ایس ڈی کے لیے تجارتی سگنل: 1.1602 سے نیچے فروخت کریں (200 ای ایم اے - 7/8 مرے)

اگر یورو ٹوٹ جاتا ہے اور 1.1602 سے اوپر مستحکم ہوتا ہے، تو ہم بحالی کی توقع کر سکتے ہیں، اور یورو / یو ایس ڈی 1.1718

Dimitrios Zappas 21:03 2025-08-04 UTC+2

اگست 4-7 2025 کے لیے بٹ کوائن (بی ٹی سی / یو ایس ڈی) کے لیے تجارتی سگنل: $115,625 سے نیچے فروخت کریں یا $114,086 سے اوپر خریدیں (200 ای ایم اے - 21 ایس ایم اے)

اگر بٹ کوائن اپنے بیئرش چکر کو دوبارہ شروع کرتا ہے، تو ہم اس کے $114,000 سے نیچے گرنے کی توقع کر سکتے ہیں۔ اس کے بعد، یہ 4/8

Dimitrios Zappas 20:59 2025-08-04 UTC+2

اگست 4-7 2025 کے لیے سونے (ایکس اے یو / یو ایس ڈی) کے لیے تجارتی سگنل: $3,385 سے نیچے فروخت (21 ایس ایم اے - 6/8 مرے)

آنے والے گھنٹوں میں، ہم 6/8 مرے کی سطح پر 3,359 پر ہدف کے ساتھ 3,385 سے نیچے سونا فروخت کر سکتے ہیں۔ اگر سونا اس علاقے سے نیچے

Dimitrios Zappas 20:56 2025-08-04 UTC+2

ایکس اے یو / یو ایس ڈی : تجزیہ اور پیشن گوئی

چارگھنٹے کے چارٹ پر تکنیکی نقطہ نظر سے، 100 پیریڈ سادہ موونگ ایوریج (ایس ایم اے) سے نیچے حالیہ وقفے کو ایک اہم بیئرش سگنل کے طور پر دیکھا

Irina Yanina 19:19 2025-07-30 UTC+2

یورو / جے پی وائے - تجزیہ، پیشن گوئی، اور موجودہ مارکیٹ کی صورتحال

امریکہ اور یورپی یونین کے درمیان ممکنہ طور پر غیر متوازن تجارتی معاہدے پر خدشات کے درمیان یورو نسبتاً کمزور کارکردگی دکھا رہا ہے۔ اس کے علاوہ، مارکیٹ اس ہفتے

Irina Yanina 19:14 2025-07-29 UTC+2
ابھی فوری بات نہیں کرسکتے ؟
اپنا سوال پوچھیں بذریعہ چیٹ.
Widget callback
 

Dear visitor,

Your IP address shows that you are currently located in the USA. If you are a resident of the United States, you are prohibited from using the services of InstaFintech Group including online trading, online transfers, deposit/withdrawal of funds, etc.

If you think you are seeing this message by mistake and your location is not the US, kindly proceed to the website. Otherwise, you must leave the website in order to comply with government restrictions.

Why does your IP address show your location as the USA?

  • - you are using a VPN provided by a hosting company based in the United States;
  • - your IP does not have proper WHOIS records;
  • - an error occurred in the WHOIS geolocation database.

Please confirm whether you are a US resident or not by clicking the relevant button below. If you choose the wrong option, being a US resident, you will not be able to open an account with InstaForex anyway.

We are sorry for any inconvenience caused by this message.