empty
20.03.2025 11:41 AM
EUR/USD. March 20th. Bears Failed to Regain Control Once Again

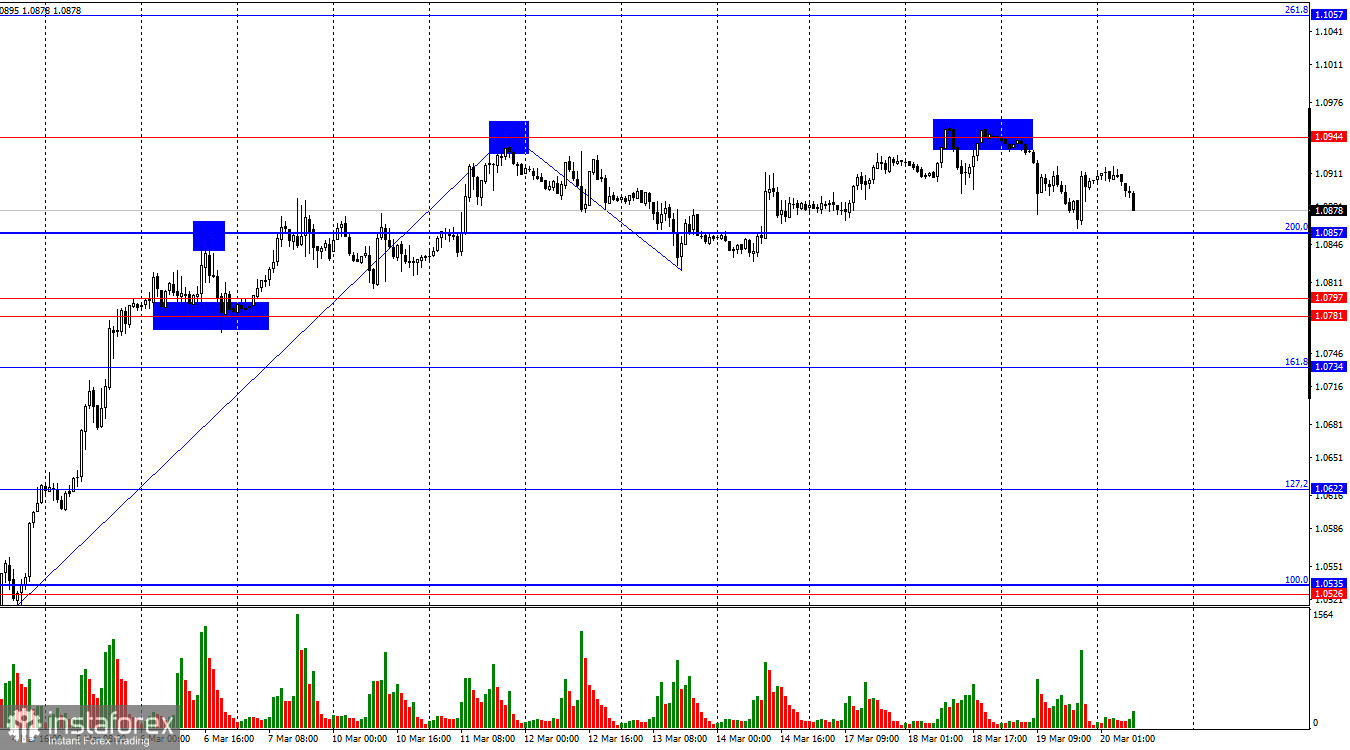
On Wednesday, the EUR/USD pair rebounded from the 1.0944 level for the third time and reversed in favor of the U.S. dollar, declining toward the 200.0% Fibonacci level at 1.0857. A rebound from this level would once again favor the euro and lead to renewed growth toward 1.0944. A firm consolidation below 1.0857 would increase the likelihood of a continued decline towards the support zone at 1.0781–1.0797, signaling the beginning of a bearish trend.

This image is no longer relevant

The wave structure on the hourly chart has shifted. The last downward wave did not break the previous low, while the latest upward wave surpassed the previous peak, but only by a few pips. This suggests that the bullish trend is still in place, but a reversal may be imminent, as bulls appear to be losing momentum. Donald Trump's tariffs have pressured the dollar for weeks, but even the bulls now need a break.

Wednesday's fundamental backdrop was quite interesting. I won't go into every report of the day because the main event occurred in the evening. The FOMC left interest rates unchanged, and committee members confirmed their plan to cut rates twice in 2025. However, several FOMC members turned more hawkish, now expecting only one rate cut this year. In my view, this represents a hawkish shift in Fed sentiment, yet the dollar failed to react accordingly. Jerome Powell stated during his press conference that inflation this year may be higher than expected and that Trump's tariffs add uncertainty to markets and the economy. The Fed Chair did not speculate on how trade policy might impact growth, inflation, or GDP, but he reaffirmed that the U.S. economy remains strong and that the Fed is fully committed to bringing inflation back to 2%. The Fed's meeting results were slightly more hawkish than expected, yet this had no immediate impact on the dollar—at least not yesterday.

This image is no longer relevant

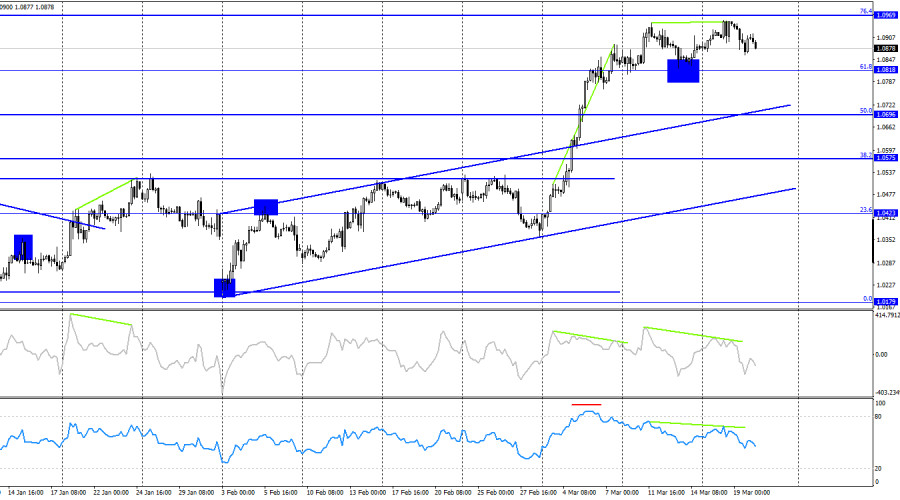
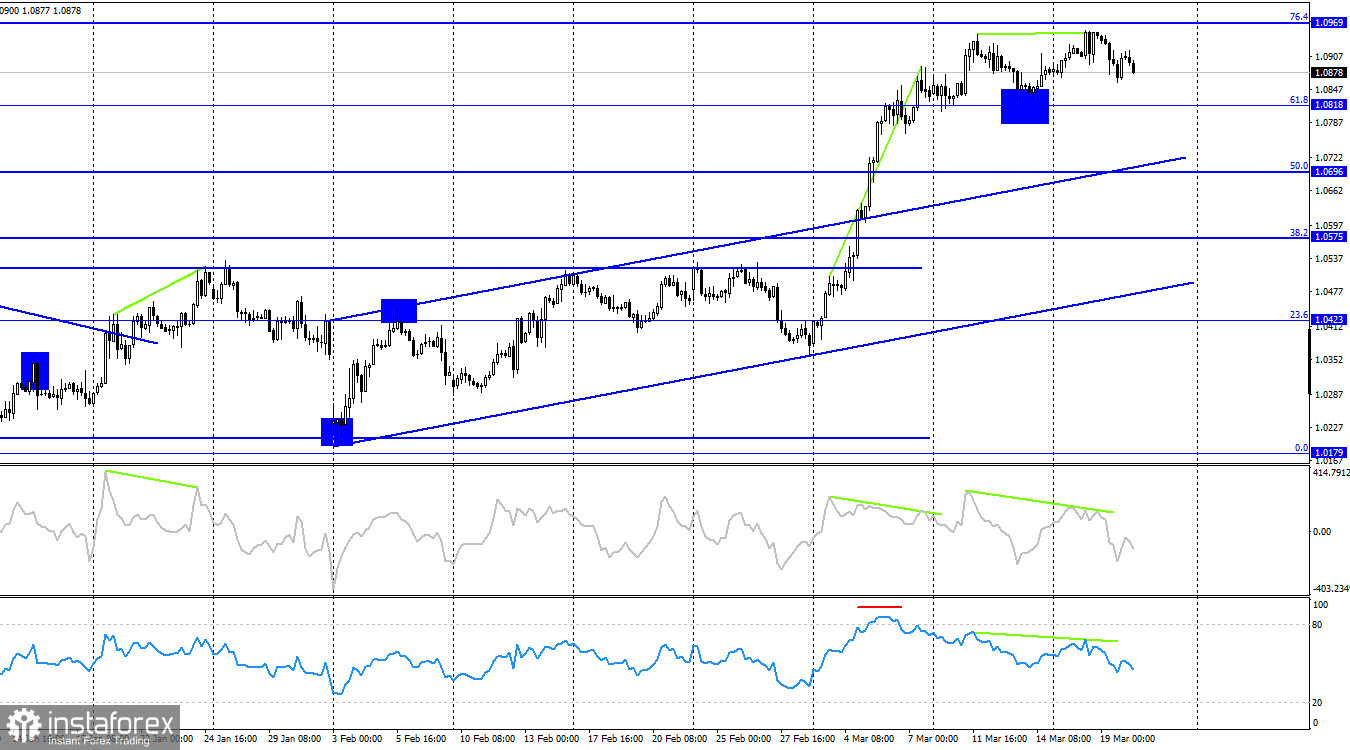
On the 4-hour chart, the pair continues its upward movement after breaking above the horizontal range. The trend is now bullish, as indicated by the ascending trend channel. A rejection from the 61.8% Fibonacci level at 1.0818 suggests further growth toward the next retracement level at 76.4% – 1.0969. However, bearish divergences are forming on the CCI and RSI indicators, signaling a potential upcoming decline. On the hourly chart, a correction is also looming. The Fed has provided the dollar with an opportunity to strengthen, and this move may have already begun.

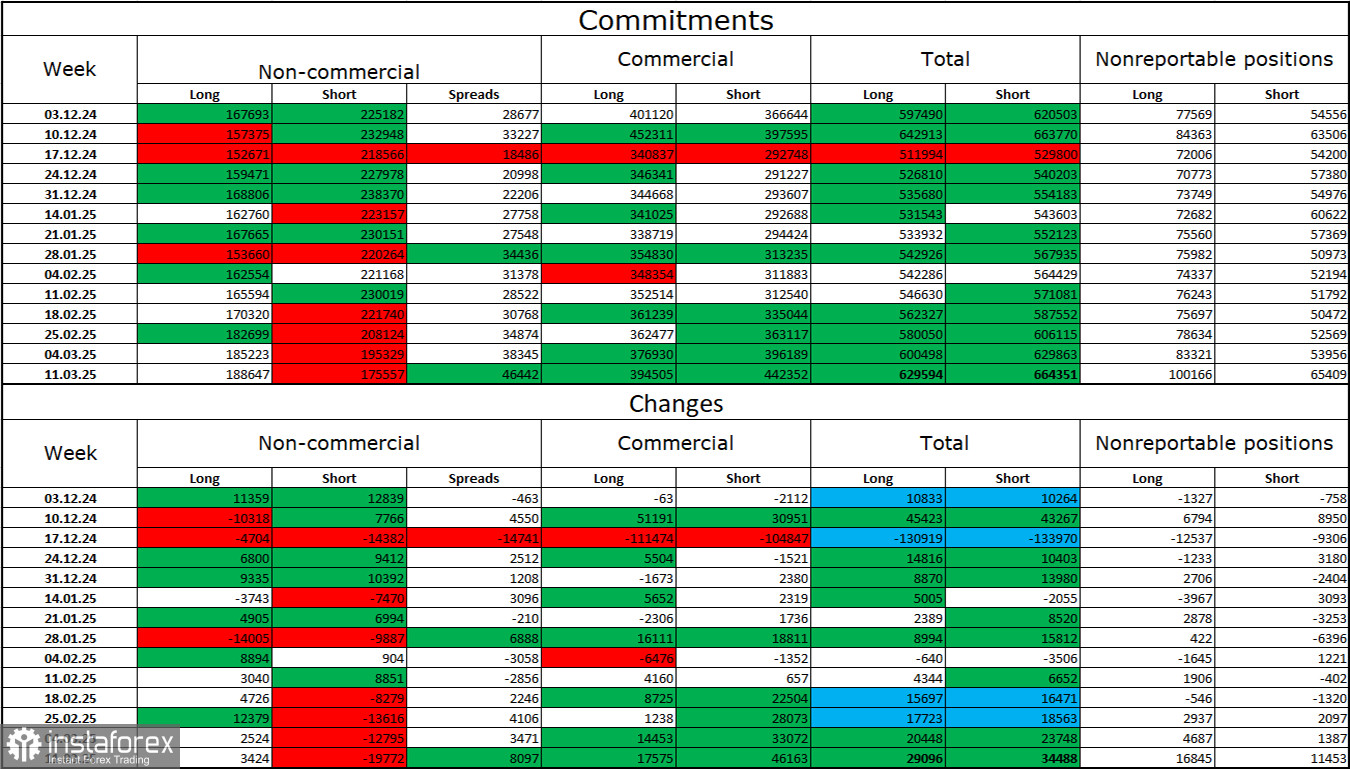
Commitments of Traders (COT) Report:

This image is no longer relevant

Over the last reporting week, professional traders opened 3,424 long positions and closed 19,772 short positions. This shift has returned the "Non-commercial" category to a bullish stance—thanks to Donald Trump. The total number of long positions held by speculators now stands at 188K, while short positions amount to 175K.

For twenty consecutive weeks, institutional players were selling euros, but for the past five weeks, they have been reducing short positions and adding to long positions. The divergence in monetary policy between the ECB and the Fed suggests that the rate differential should favor the dollar, but Trump's trade policies have become a more decisive factor for traders. His policies may force the Fed into a more dovish stance and increase recession risks in the U.S. economy.

Economic Calendar for the U.S. and the Eurozone:

Eurozone:

  • ECB President Christine Lagarde's speech (08:00 UTC)

United States:

  • Initial jobless claims (12:30 UTC)
  • Philadelphia Fed Business Outlook Index (12:30 UTC)
  • Existing home sales (14:00 UTC)

On March 20, the economic calendar contains four key events, though only Lagarde's speech is of significant importance. The overall fundamental impact on market sentiment may be weak on Thursday.

EUR/USD Forecast and Trading Advice:

Sell positions were possible on a rejection from 1.0944 on the hourly chart, with targets at 1.0857 and 1.0797. These trades can remain open for now. Buy positions can be considered, but I remain cautious about the pair's strong and nearly uninterrupted rally. I am skeptical about one-directional movements like this. At this point, I believe the trend is starting to shift in favor of the bears.

Fibonacci retracement levels are built from 1.0529 to 1.0213 on the hourly chart and from 1.1214 to 1.0179 on the 4-hour chart.

Samir Klishi,
Analytical expert of InstaForex
© 2007-2025
Summary
Urgency
Analytic
Grigory Sokolov
Start trade
Earn on cryptocurrency rate changes with InstaForex
Download MetaTrader 4 and open your first trade
  • Grand Choice
    Contest by
    InstaForex
    InstaForex always strives to help you
    fulfill your biggest dreams.
    JOIN CONTEST

Recommended Stories

GBP/USD. Technical Analysis for the Week of July 28 – August 2

Last week, the pair moved upward and tested the historical resistance level at 1.3591 (blue dashed line), then reversed and closed the weekly candle at 1.3435. In the upcoming week

Stefan Doll 19:16 2025-07-28 UTC+2

EUR/USD. Technical Analysis for the Week of July 28 – August 2

Last week, the pair moved upward and tested the upper fractal at 1.1790 (weekly candle from July 6, 2025), after which the price turned downward, closing the weekly candle

Stefan Doll 19:12 2025-07-28 UTC+2

Forex forecast 28/07/2025: EUR/USD, USD/JPY, GBP/USD, Gold, Ethereum and Bitcoin

Useful links: My other articles are available in this section InstaForex course for beginners Popular Analytics Open trading account Important: The begginers in forex trading need to be very careful

Sebastian Seliga 11:32 2025-07-28 UTC+2

EUR/USD. Analysis and Forecast

At the start of the new week during the Asian session, the EUR/USD pair attempted to remain positive, but during the European session, prices fell below the 1.1750 level amid

Irina Yanina 11:13 2025-07-28 UTC+2

EUR/USD – July 28th: The EU and U.S. Reach an Agreement

On Friday, the EUR/USD pair returned to the 127.2% retracement level at 1.1712 and rebounded from it. This suggests that the upward movement may continue toward the next level

Samir Klishi 10:58 2025-07-28 UTC+2

GBP/USD – July 28th: The U.S. and China Reach an Agreement as Well

On the hourly chart, the GBP/USD pair continued its decline on Friday toward the 1.3425 level after closing below the 76.4% retracement level at 1.3470. Today, a firm move below

Samir Klishi 10:40 2025-07-28 UTC+2

With today's Golden Cross on USD/CAD, the Loonie has the potential to strengthen and rise to its nearest resistance level on Monday, July 28, 2025.

USD/CAD – Monday, July 28, 2025 Although the RSI (14) is at a neutral-bearish level, the Golden Cross condition between the 50-EMA and 200-EMA indicates a bullish bias, so USD/CAD

Arief Makmur 08:07 2025-07-28 UTC+2

Fiber has the potential to weaken today, with the Pivot level potentially being broken, Monday, July 28, 2025.

EUR/USD – Monday, July 28, 2025. With the appearance of a divergence between Fiber's price movement and the RSI(14) indicator, although the 50 and 200 EMAs (Golden Cross & RSI(14)

Arief Makmur 08:07 2025-07-28 UTC+2

Trading Signals for EUR/USD for July 28-30, 2025: sell below 1.1780 (21 SMA - 8/8 Murray)

Early in the American session, the euro is trading around 1.1752, bouncing back after finding good support around 1.1718. Last week, the euro sharply broke out of the uptrend channel

Dimitrios Zappas 06:43 2025-07-28 UTC+2

Trading Signals for BITCOIN for July 28-30, 2025: sell below $119,800 (200 EMA - 21 SMA)

Bitcoin is in a correction phase after recently reaching $19,750. BTC is undergoing a technical correction, so the price is likely to drop in the coming hours toward the 21SMA

Dimitrios Zappas 06:41 2025-07-28 UTC+2
Can't speak right now?
Ask your question in the chat.
Widget callback
 

Dear visitor,

Your IP address shows that you are currently located in the USA. If you are a resident of the United States, you are prohibited from using the services of InstaFintech Group including online trading, online transfers, deposit/withdrawal of funds, etc.

If you think you are seeing this message by mistake and your location is not the US, kindly proceed to the website. Otherwise, you must leave the website in order to comply with government restrictions.

Why does your IP address show your location as the USA?

  • - you are using a VPN provided by a hosting company based in the United States;
  • - your IP does not have proper WHOIS records;
  • - an error occurred in the WHOIS geolocation database.

Please confirm whether you are a US resident or not by clicking the relevant button below. If you choose the wrong option, being a US resident, you will not be able to open an account with InstaForex anyway.

We are sorry for any inconvenience caused by this message.